
Visual Explainers
Data you can read at a glance
26 infographics on AI, technology, money and work, newest first. Open a tile for what it shows, its source and the one takeaway, or see the full infographic with the numbers behind it, the method and a code to embed it. Tiles marked Interactive open a page you scroll through section by section.
All infographics, newest first
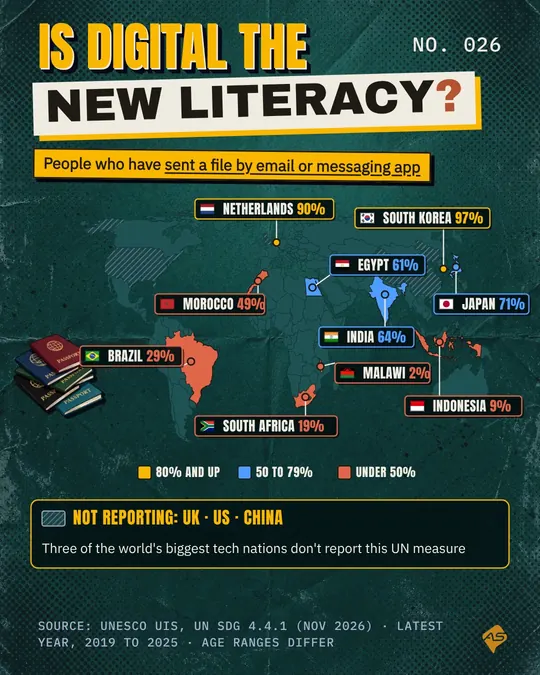
What it shows: The share of people in each country who have sent a file by email, a messaging app or text, from the UN’s digital skills indicator.
Source: UNESCO UIS, UN SDG 4.4.1 (Nov 2026)
Takeaway: 97% of people in South Korea have sent a file by email or messaging app, against 2% in Malawi. The UK, US and China do not report this UN measure.
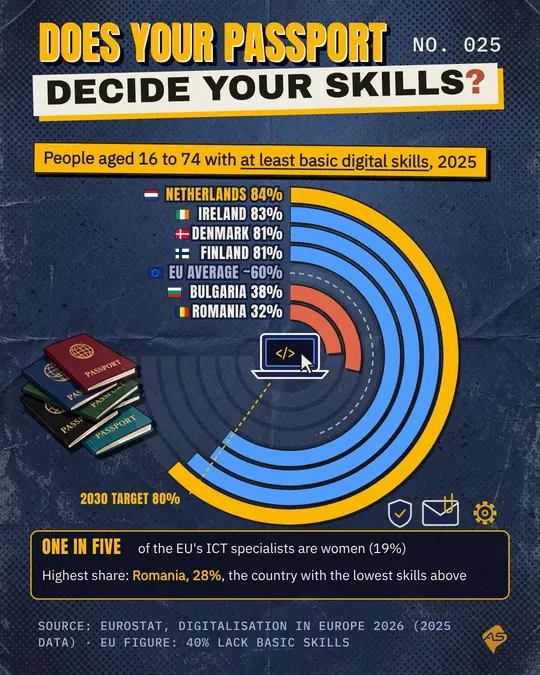
See the full infographic: Is digital the new literacy?Was this useful?What it shows: The share of people aged 16 to 74 in EU countries with at least basic digital skills in 2025, against the EU’s 2030 target.
Source: Eurostat, Digitalisation in Europe 2026 (2025 data)
Takeaway: In 2025, 84% of people in the Netherlands had at least basic digital skills, against 32% in Romania. The EU average is about 60%; the target is 80%.
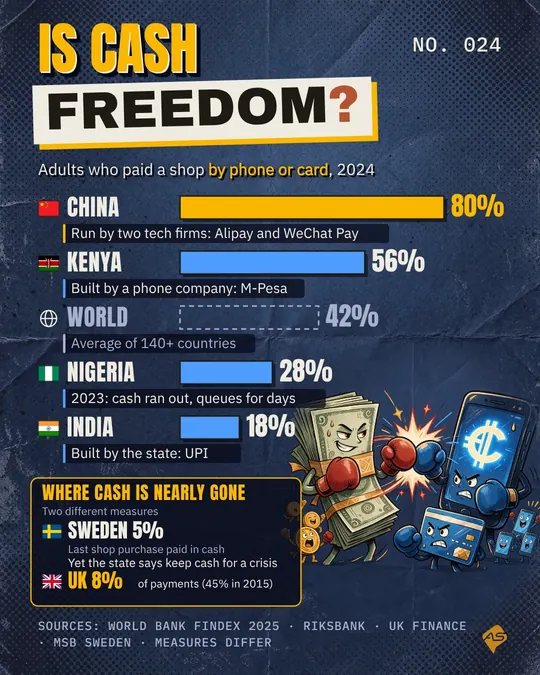
See the full infographic: Does your passport decide your skills?Was this useful?What it shows: Who built each country’s digital payment system, and how many adults pay shops digitally, beside two countries where cash is nearly gone.
Source: World Bank Findex 2025, Riksbank, UK Finance, MSB Sweden
Takeaway: In 2024, 80% of adults in China paid a shop by phone or card, against a world average of 42%. In the UK, cash fell from 45% of payments to 8%.
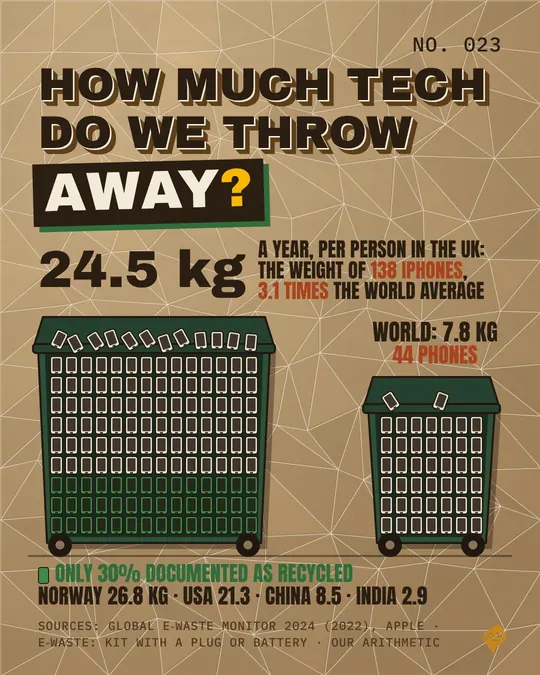
See the full infographic: Is cash freedom?Was this useful?What it shows: How much electronic waste each person produces a year in the UK and other countries.
Source: Global E-waste Monitor 2024 (2022 data), Apple
Takeaway: Each person in the UK throws away 24.5 kg of electronics a year: 138 iPhones’ weight and 3.1 times the world average. Only 30% is documented as recycled.
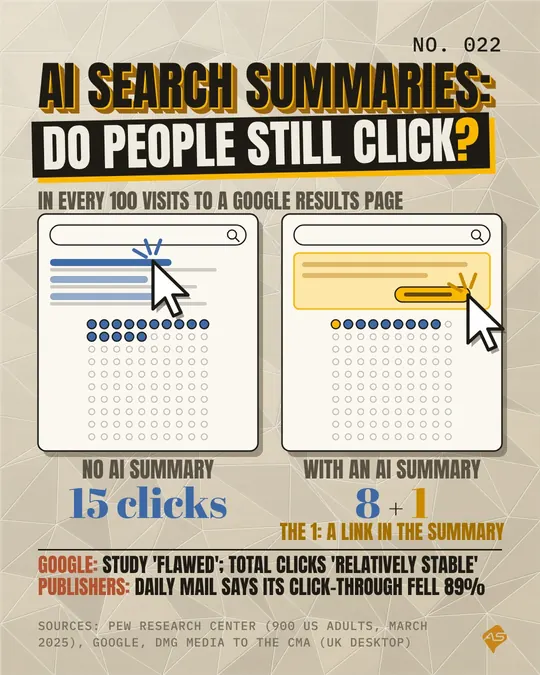
See the full infographic: How much tech do we throw away?Was this useful?What it shows: How often people click a result on Google’s results pages with and without an AI summary.
Source: Pew Research Center, Google, DMG Media to the CMA
Takeaway: People clicked a result on 15 in 100 Google results pages without an AI summary. With one, it was 8, plus 1 click on a link inside the summary.
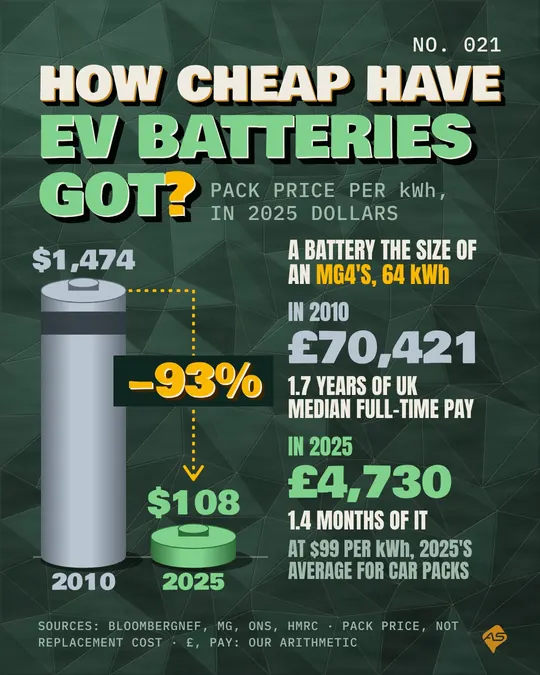
See the full infographic: AI search summaries: do people still click?Was this useful?What it shows: The average price of lithium-ion battery packs per kWh from 2010 to 2025, applied to one family car’s battery.
Source: BloombergNEF, MG, ONS, HMRC
Takeaway: Battery pack prices fell 93%, from $1,474 per kWh in 2010 to $108 in 2025. An MG4-size pack went from about £70,421 to about £4,730.
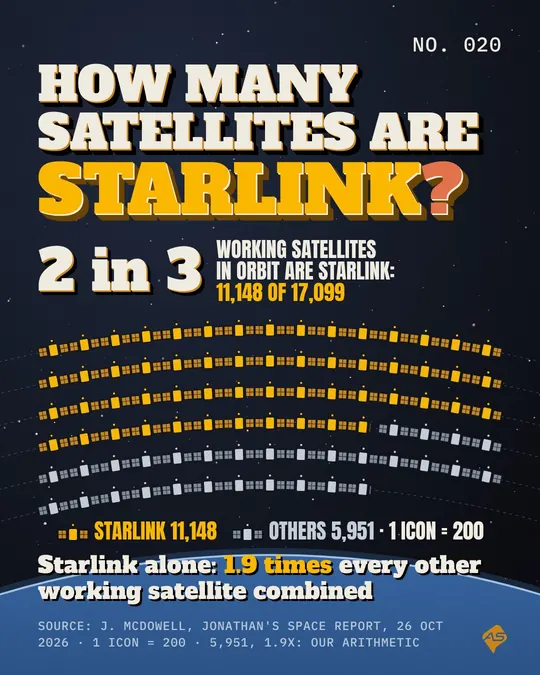
See the full infographic: How cheap have EV batteries got?Was this useful?What it shows: How many of the working satellites in orbit belong to the Starlink network.
Source: J. McDowell, Jonathan’s Space Report, 26 Oct 2026
Takeaway: Of 17,099 working satellites in orbit, 11,148 are Starlink: 2 in 3, and 1.9 times every other working satellite combined.
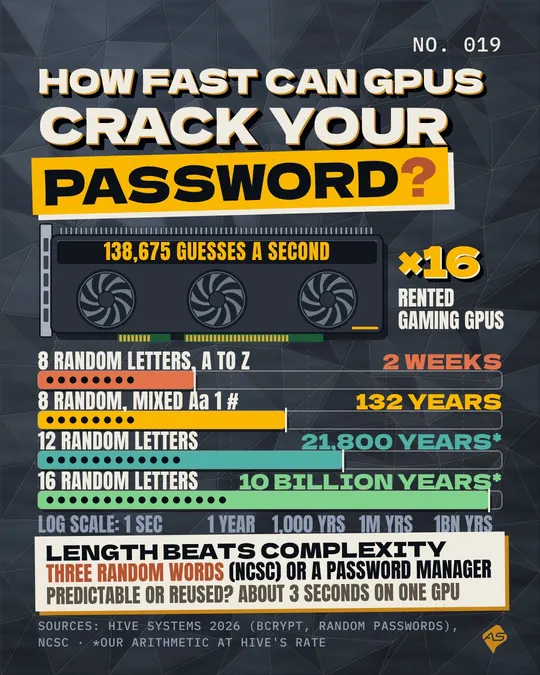
See the full infographic: How many satellites are Starlink?Was this useful?What it shows: How long a rig of 16 rented gaming GPUs would take to guess random passwords of different lengths.
Source: Hive Systems 2026, NCSC
Takeaway: 16 rented gaming GPUs would crack 8 random lowercase letters in about 2 weeks; 16 random letters would take about 10 billion years.
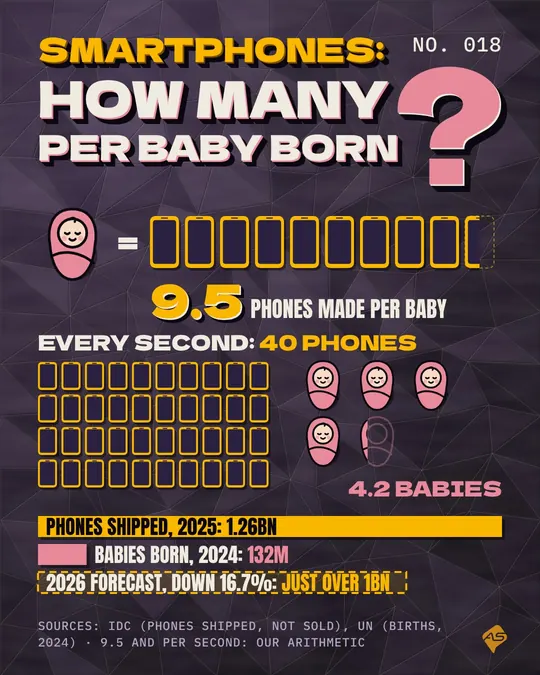
See the full infographic: How fast can GPUs crack your password?Was this useful?What it shows: Smartphones shipped worldwide in 2025 against babies born worldwide in 2024.
Source: IDC (phones shipped, not sold), UN (births, 2024)
Takeaway: The world shipped 1.26 billion smartphones in 2025 against 132 million babies born: 9.5 phones per baby, about 40 phones every second against 4.
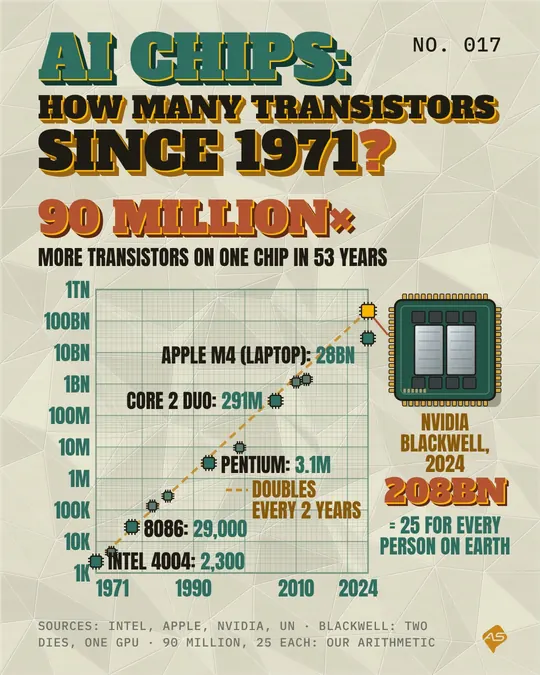
See the full infographic: Smartphones: how many per baby born?Was this useful?What it shows: Transistor counts on single chips, from Intel’s first microprocessor in 1971 to Nvidia’s Blackwell AI chip in 2024.
Source: Intel, Apple, Nvidia, UN
Takeaway: Intel’s 4004 had 2,300 transistors in 1971; Nvidia’s Blackwell has 208 billion: 90 million times as many in 53 years.
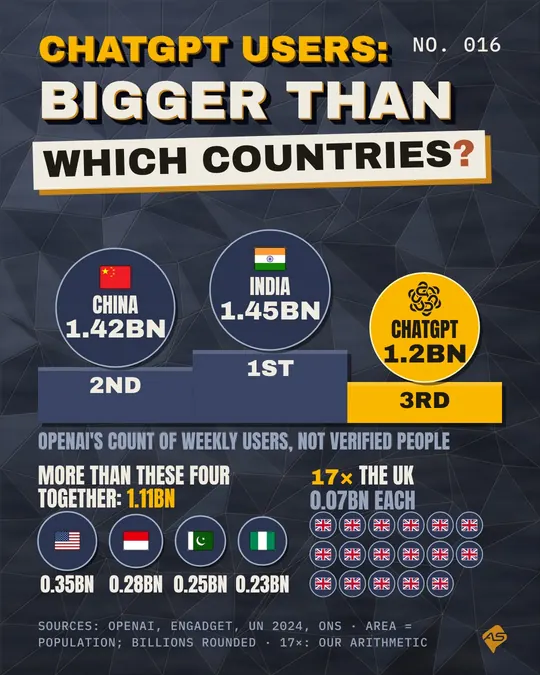
See the full infographic: AI chips: how many transistors since 1971?Was this useful?What it shows: OpenAI’s count of ChatGPT weekly users set against the populations of the world’s largest countries.
Source: OpenAI, Engadget, UN 2024, ONS
Takeaway: OpenAI counts 1.2 billion weekly ChatGPT users. As a country, that would rank third, behind India and China, at 17 times the UK’s population.
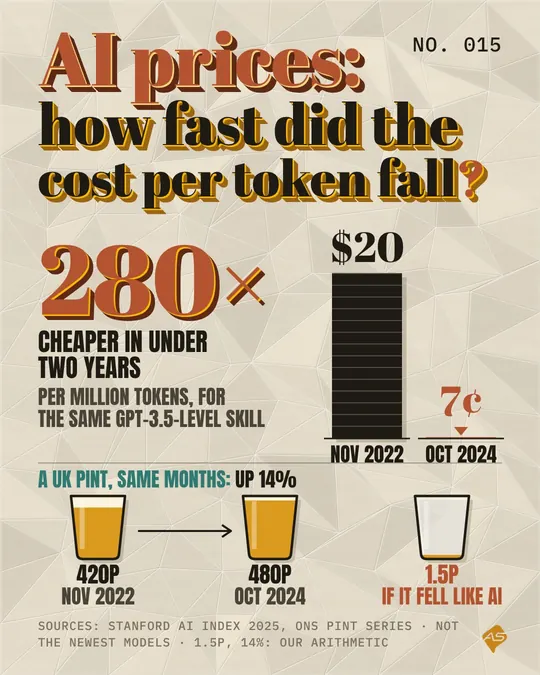
See the full infographic: ChatGPT users: bigger than which countries?Was this useful?What it shows: How the price of the same level of AI skill fell between November 2022 and October 2024, next to the price of a UK pint.
Source: Stanford AI Index 2025, ONS pint series
Takeaway: For the same GPT-3.5-level skill, AI fell from $20 to 7 cents per million tokens in under two years: 280 times cheaper. A UK pint rose 14%.
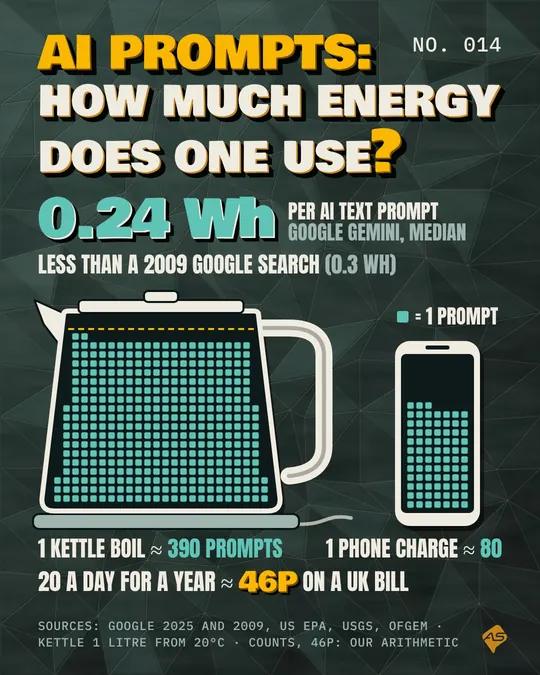
See the full infographic: AI prices: how fast did the cost per token fall?Was this useful?What it shows: The energy one AI text prompt uses, compared with a kettle, a phone charge and a year on a UK electricity bill.
Source: Google 2025 and 2009, US EPA, USGS, Ofgem
Takeaway: A typical Gemini text prompt uses about 0.24 Wh, less than a 2009 Google search. A kettle boil is about 390 prompts; 20 a day for a year, about 46p.
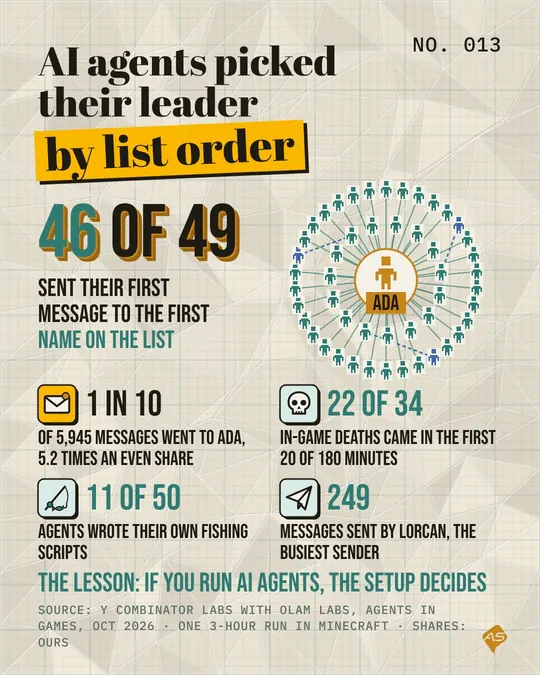
See the full infographic: AI prompts: how much energy does one use?Was this useful?What it shows: What 50 AI agents did in one three-hour run in Minecraft, given one goal: build a thriving civilisation.
Source: Y Combinator Labs with Olam Labs, Oct 2026
Takeaway: 46 of 49 AI agents sent their first message to Ada, the first name on the list, and she ended up with 1 in 10 of all messages. The setup decides who leads.
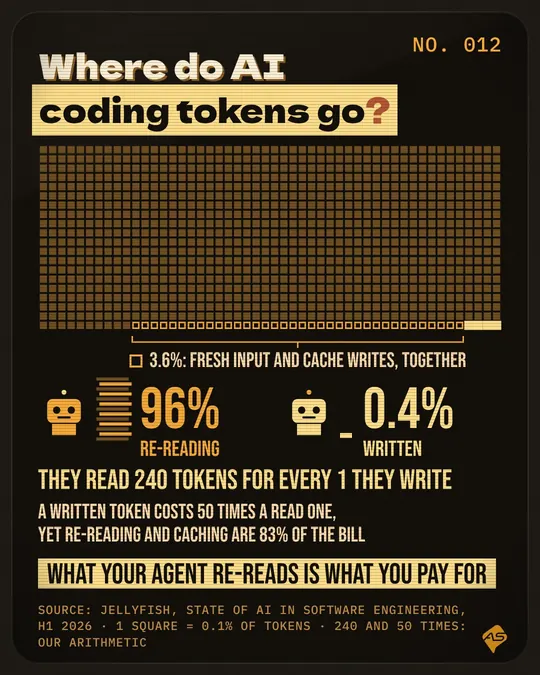
See the full infographic: AI agents picked their leader by list orderWas this useful?What it shows: How AI coding agents’ tokens split between re-reading context and writing new code, and how that shows up on the bill.
Source: Jellyfish, State of AI in Software Engineering, H1 2026
Takeaway: AI coding agents spend 96% of tokens re-reading and 0.4% writing code: 240 read for every 1 written. Re-reading and caching are 83% of the bill.
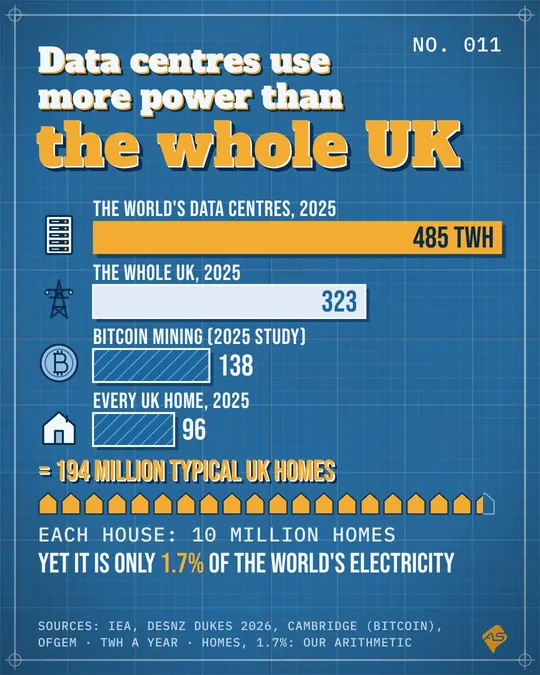
See the full infographic: Where do AI coding tokens go?Was this useful?What it shows: The electricity used by the world’s data centres in 2025, compared with the whole UK, every UK home and Bitcoin mining.
Source: IEA, DESNZ DUKES 2026, Cambridge, Ofgem
Takeaway: The world’s data centres used 485 TWh of electricity in 2025, more than the whole UK’s 323 TWh, yet only 1.7% of the world’s electricity.
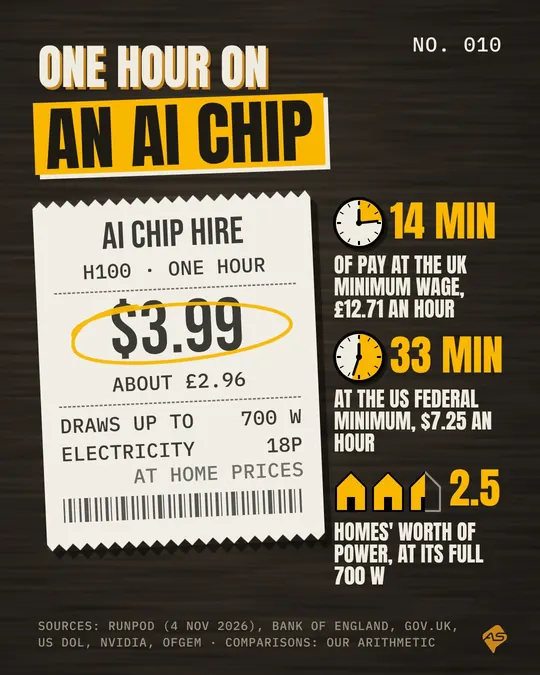
See the full infographic: Data centres use more power than the whole UKWas this useful?What it shows: What it costs to rent one Nvidia H100 AI chip for an hour, set against familiar hourly costs.
Source: Runpod, Bank of England, GOV.UK, US DOL, NVIDIA, Ofgem
Takeaway: Renting an Nvidia H100 for an hour costs $3.99, about £2.96: 14 minutes of pay at the UK minimum wage, or 33 minutes at the US federal minimum.
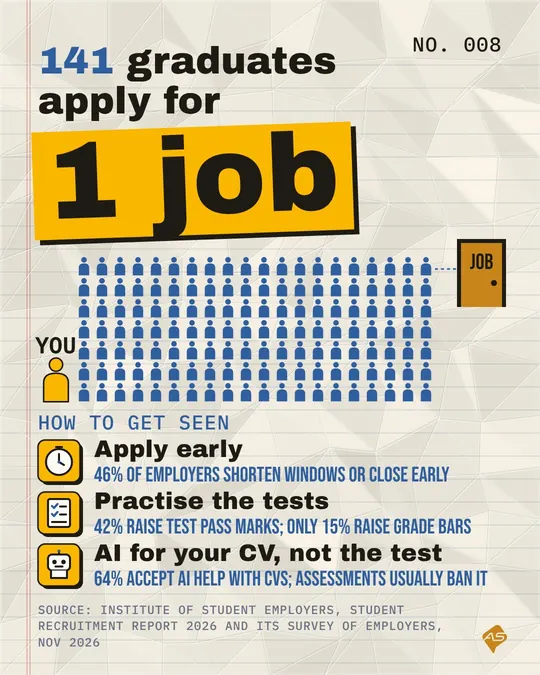
See the full infographic: One hour on an AI chipWas this useful?What it shows: How many applications UK graduate employers receive for each job, and what employers are doing about the volume.
Source: Institute of Student Employers, 2026
Takeaway: 141 graduates apply for every UK graduate job, 172 in London. Apply early, practise the tests, and use AI for your CV but not the assessments.
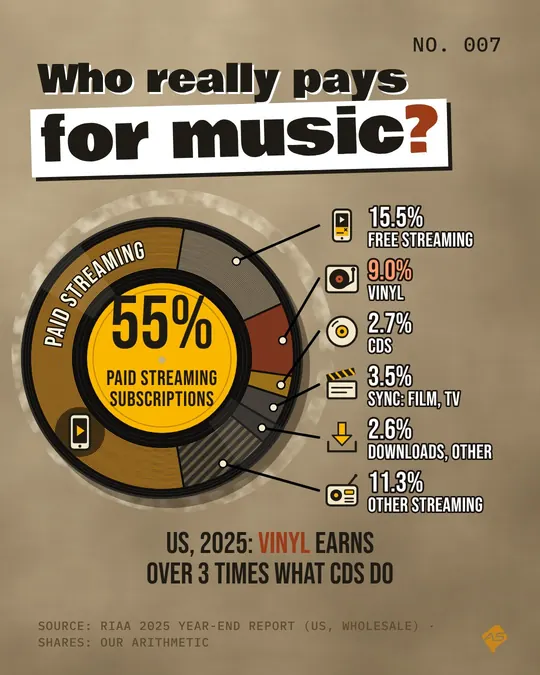
See the full infographic: 141 graduates apply for 1 jobWas this useful?What it shows: Where US recorded music revenue came from in 2025, by format, at wholesale value.
Source: RIAA 2025 year-end report (US, wholesale)
Takeaway: Paid streaming subscriptions brought in 55% of US recorded music money in 2025. Vinyl earned 9.0%, over three times the 2.7% from CDs.
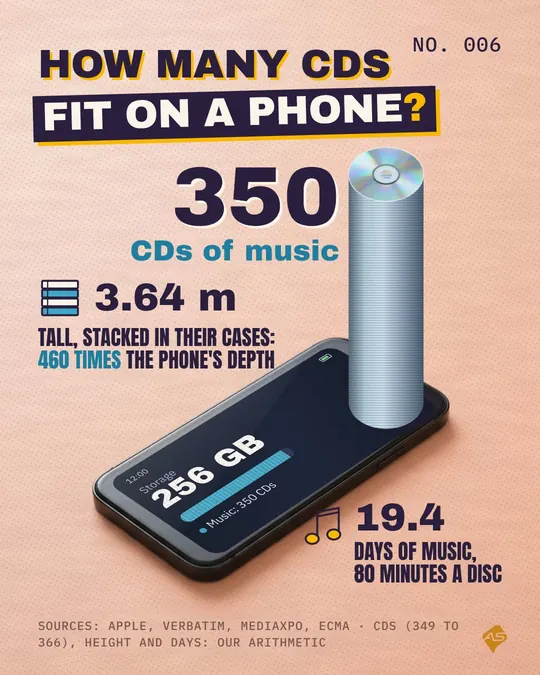
See the full infographic: Who really pays for music?Was this useful?What it shows: How many audio CDs’ worth of data a 256 GB phone holds, and how tall, long and heavy that collection would be.
Source: Apple, Verbatim, Mediaxpo, Ecma
Takeaway: A 256 GB phone holds the data of about 350 CDs: a 3.64 m stack in their cases and 19.4 days of music, in a phone that weighs 177 g.
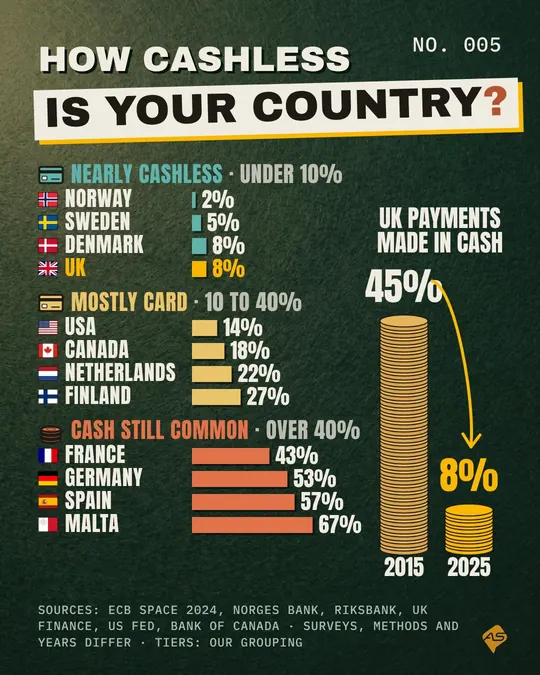
See the full infographic: How many CDs fit on a phone?Was this useful?What it shows: How much each country still pays in cash, as its own survey measures it, in three tiers, with the UK’s fall since 2015.
Source: ECB SPACE 2024, central banks, UK Finance
Takeaway: In 2015, 45% of UK payments were made in cash; by 2025 it was 8%. Norway is down to 2%, while in Malta 67% of shop payments are still cash.
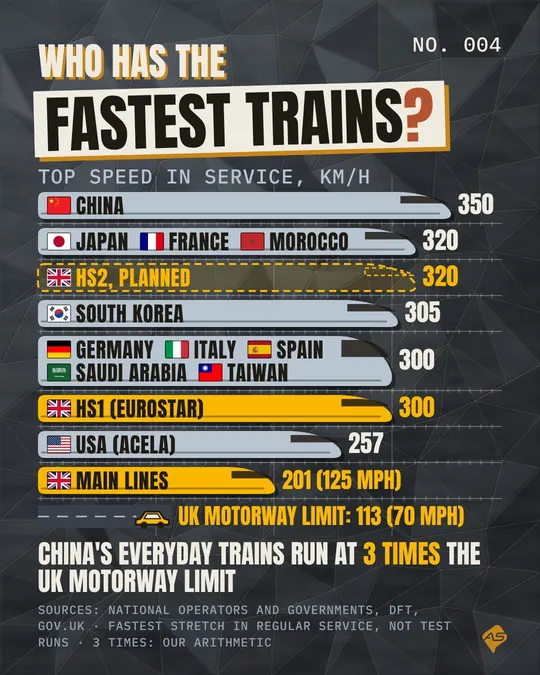
See the full infographic: How cashless is your country?Was this useful?What it shows: Top speeds in regular passenger service on each country’s fastest stretch of line, with Britain’s lines and the UK motorway limit for scale.
Source: National operators and governments, DfT, GOV.UK
Takeaway: China’s everyday trains run at 350 km/h, about 3 times the UK motorway limit. Britain’s fastest line, HS1, runs at 300 km/h.
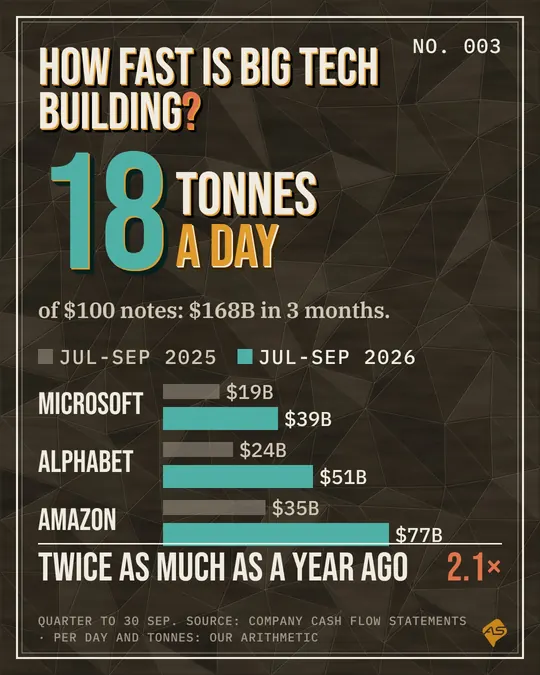
See the full infographic: Who has the fastest trains?Was this useful?What it shows: What Microsoft, Alphabet and Amazon spent on buildings and equipment in one quarter, against the same quarter a year earlier.
Source: Company cash flow statements, quarter to 30 Sep
Takeaway: Microsoft, Alphabet and Amazon spent about $168 billion on buildings and equipment in the three months to September 2026: 2.1 times a year earlier.
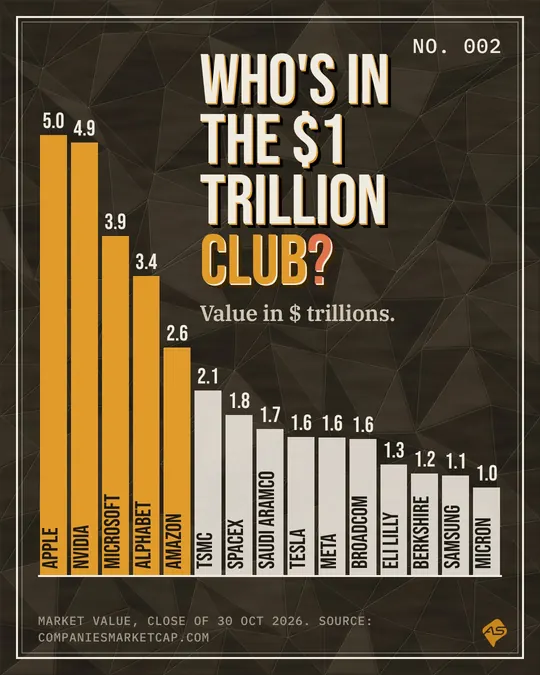
See the full infographic: How fast is big tech building?Was this useful?What it shows: The 15 companies valued at $1 trillion or more at the market close on 30 October 2026, by market value.
Source: CompaniesMarketCap.com, 30 Oct 2026 close
Takeaway: Fifteen companies were worth $1 trillion or more on 30 October 2026. Apple led at $5.029 trillion, with NVIDIA close behind at $4.941 trillion.
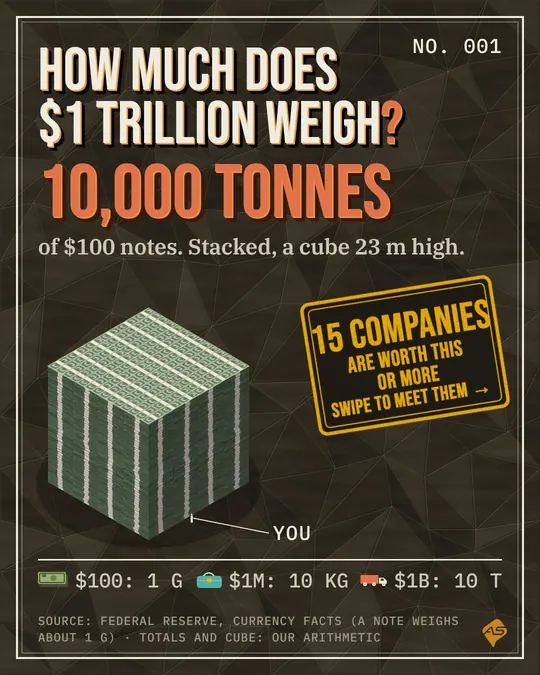
See the full infographic: Who’s in the $1 trillion club?Was this useful?What it shows: The weight of $1 trillion in $100 notes, and the size of the pile if every note were stacked into one block.
Source: Federal Reserve, Currency Facts
Takeaway: A trillion dollars in $100 notes is 10 billion notes. At about a gram each, that is roughly 10,000 tonnes: a cube about 23 metres high.
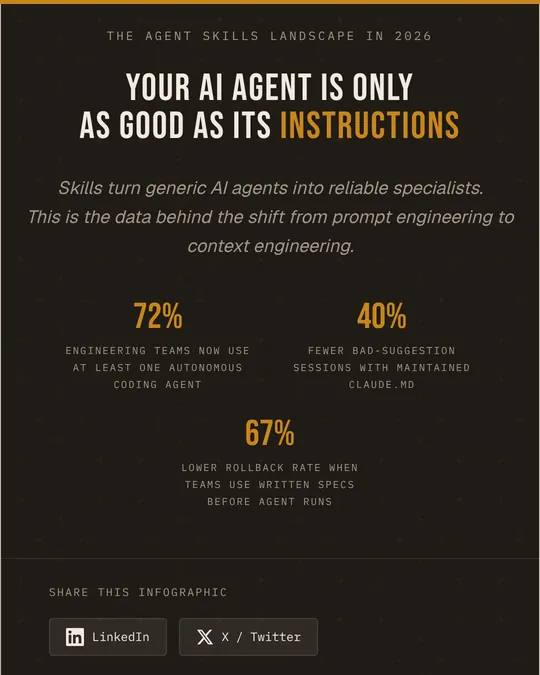
See the full infographic: How much does $1 trillion weigh?Was this useful?What it shows: The AI agent skills ecosystem on one scrollable page: which config file each coding tool reads, security data on published skills, impact metrics and when to use rules, skills or AGENTS.md.
Source: Snyk, Anthropic, Martin Fowler, Block Engineering and others, listed on the page
Takeaway: Snyk found 36.8% of agent skills have at least one security flaw and 13.4% have critical issues, so read a SKILL.md before you install it.
See the full infographic: Agent Skills LandscapeWas this useful?New infographics land here as they are made.
Get each new one by email, with the numbers behind it.
Subscribe to the newsletter