

No. 005 · 7 November 2026
How cashless is your country?
How much each country still pays in cash, as its own survey measures it, in three tiers, with the UK’s fall since 2015.
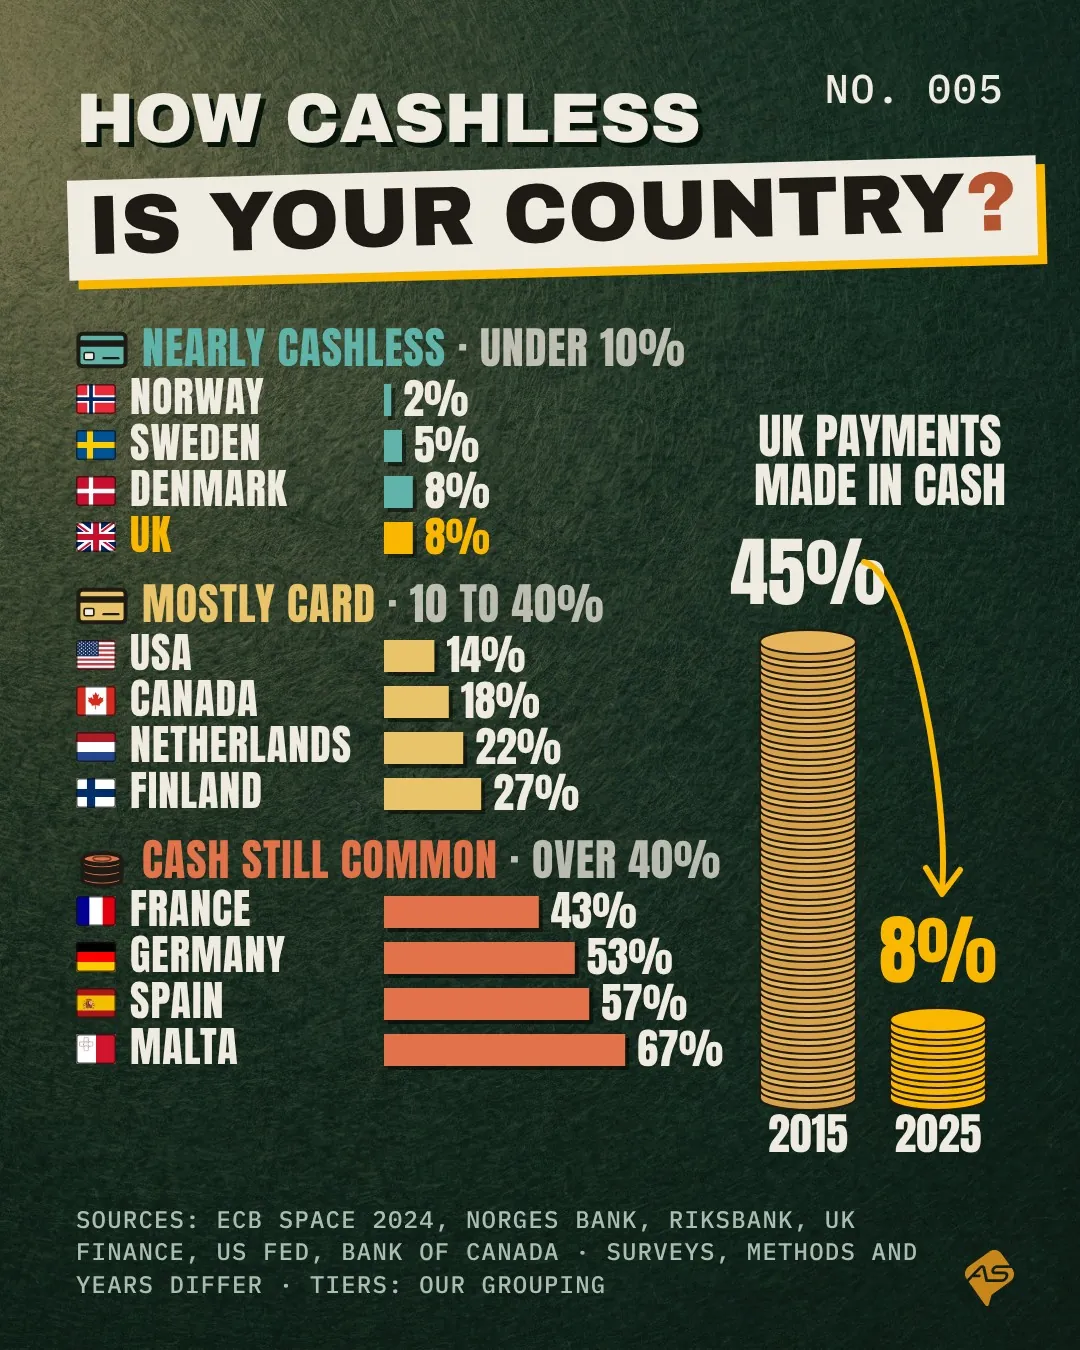
In 2015, 45% of UK payments were made in cash; by 2025 it was 8%. Norway is down to 2%, while in Malta 67% of shop payments are still cash.
The numbers behind it
| Country | Paid in cash | Measure |
|---|---|---|
| Norway | 2% | All and shop payments, spring 2025 |
| Sweden | 5% | People whose last in-store purchase was paid in cash, 2025 |
| Denmark | 8% | People whose last in-store purchase was paid in cash |
| United Kingdom | 8% | All payments by number, 2025 (45% in 2015) |
| United States | 14% | All payments by number, 2025 |
| Canada | 18% | Shop payments by number, 2025 |
| Netherlands | 22% | Shop payments by number, 2024 |
| Finland | 27% | Shop payments by number, 2024 |
| France | 43% | Shop payments by number, 2024 |
| Germany | 53% | Shop payments by number, 2024 |
| Spain | 57% | Shop payments by number, 2024 |
| Malta | 67% | Shop payments by number, 2024 |
Source and method
This chart mixes measures. Euro area countries share one (ECB SPACE 2024, shop payments by number); the UK figure covers all payments; Sweden and Denmark are the share of people whose last in-store purchase was paid in cash, not a share of payments. Years differ too. The tiers are our grouping.
- ECB, SPACE 2024 report (opens in a new tab)
- ECB, SPACE 2024 country data (spreadsheet) (opens in a new tab)
- Norges Bank, Retail payment services 2024 (opens in a new tab)
- Sveriges Riksbank, Payments Report 2026: payment habits in Sweden (opens in a new tab)
- UK Finance, Payment Markets Report for 2025 (press release, 19 August 2026) (opens in a new tab)
- Federal Reserve, 2026 Diary of Consumer Payment Choice (opens in a new tab)
- Bank of Canada, 2025 Methods-of-Payment Survey (opens in a new tab)
What it means
- Neighbours differ widely: Germany pays cash for 53% of shop payments, the Netherlands for 22%.
- The UK went from nearly half cash to under one payment in ten in a decade.
- Surveys differ, so read the tiers as a guide rather than a league table.
Was this useful?